
You can use WordPress Website Analytics to see how visitors interact with your site. Both WordPress.com and WordPress.org users can track important numbers, like visits and clicks. This helps you understand what works best for your audience. Look at the table below to see how big WordPress is and why analytics matter:
Statistic Category | Data / Figures | Why It Matters |
|---|---|---|
Global Websites Powered by WP | Shows the need for analytics | |
Total WordPress Websites | Over 532 million | Many sites rely on analytics |
WooCommerce Market Share | 34.69% of e-commerce platforms; ~110 million sites | Analytics boost online sales |
You do not need to be a tech expert to get started. Analytics tools make it easy for anyone to learn and grow.
Key Takeaways
WordPress website analytics help you understand visitor behavior and improve your site by tracking visits, clicks, and engagement.
Key metrics to watch include traffic sources, user actions, conversion rates, and how long visitors stay on your pages.
WordPress.com offers basic built-in analytics, while WordPress.org lets you use powerful tools like Google Analytics for deeper insights.
Choosing the right analytics plugin depends on your needs; some focus on privacy, others on detailed reports and eCommerce tracking.
Regularly review your analytics data to spot trends, fix issues, and make smart changes that grow your website and boost user engagement.
WordPress Website Analytics Overview

What Are Analytics?
Analytics are tools and measurements that help you see how your website performs. You can track how many people visit your site, what pages they view, and how long they stay. These numbers show you what works and what needs improvement.
You can use analytics to answer questions like:
How many visitors come to your site each day?
Which pages get the most attention?
Do users leave quickly or stay to explore?
Many websites use analytics to improve their performance. The table below shows how big WordPress is in the world of websites:
Statistic Description | Value/Insight |
|---|---|
Percentage of websites running on WordPress (2024) | |
Total WordPress websites (2024) | 861 million |
Number of free WordPress plugins | Nearly 60,000 |
Percentage of top-ranking domains using WordPress for SEO | 49% |
WooCommerce usage among eCommerce sites | 20% |
New WordPress websites published daily | Over 10,000 |
Average monthly WordPress search volume | Over 16 million |
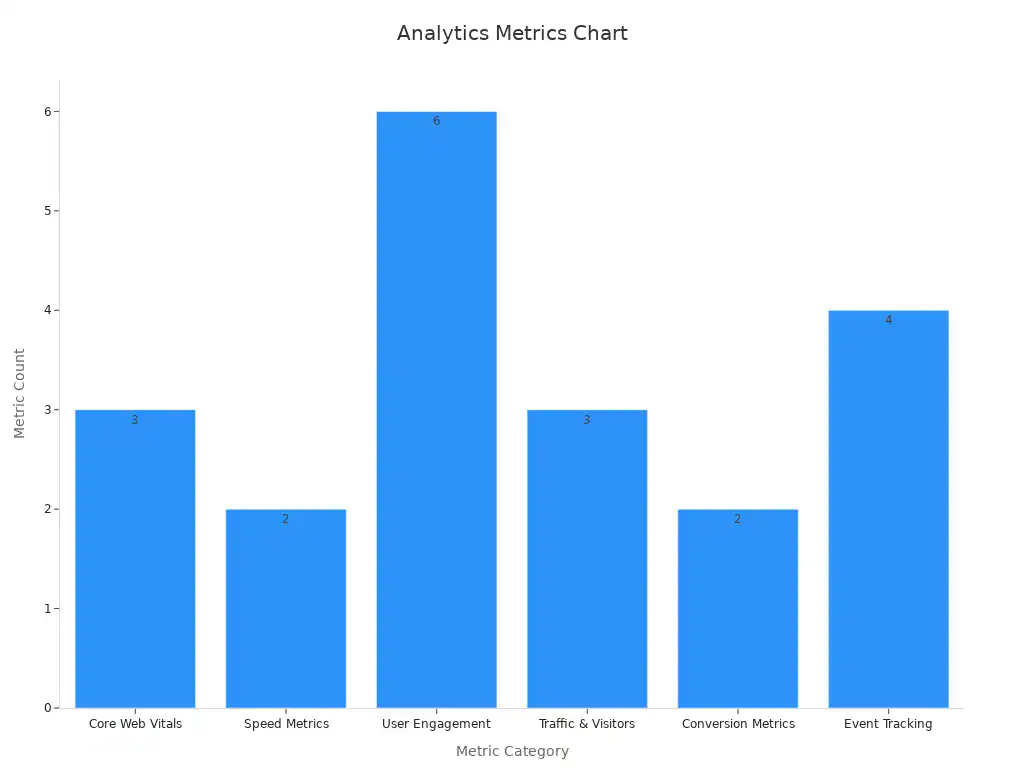
Analytics cover many areas. You can track speed, user engagement, traffic, and conversions. The chart below shows the main categories of website analytics metrics:
Why They Matter
WordPress Website Analytics help you understand your visitors. You can see what users do and why they do it. This knowledge helps you make better choices for your site.
“Behavioral analytics provides a deeper understanding of user behavior by revealing not just what users do but why they do it, unlike traditional analytics that only show basic metrics.” — Dorothea Gam, CMO at Mouseflow
You can use analytics to:
Find out what content your audience likes most.
Spot problems that make users leave your site.
Improve your site’s design and features based on real data.
Track if your changes help users stay longer or convert more.
Fix small errors before they become big issues.
Companies that use analytics see real results. McKinsey & Company reports that using behavioral insights can lead to an 85% increase in sales growth and a 25% rise in gross margin. When you use analytics, you make decisions based on facts, not guesses. This helps your website grow and succeed.
Key Metrics

Traffic
You can measure your website’s popularity by tracking traffic. Traffic shows how many people visit your site and where they come from. Important benchmarks include Users (unique visitors), Sessions (visits within a time frame), and Page Views (total pages loaded). You can also see how many users visit at the same time.
Website Type | Monthly Unique Visitors | Pageviews per Month |
|---|---|---|
Small Personal Blog | 500 – 5,000 | 1,000 – 10,000 |
Niche Content Site | 5,000 – 20,000 | 10,000 – 100,000 |
Growing Small Business Site | 20,000 – 50,000 | N/A |
Medium-Sized Publisher | 50,000 – 200,000 | N/A |
Established E-commerce Site | 100,000 – 500,000+ | 100,000+ |
Large Media/Corporate Site | 500,000 – 1,000,000+ | N/A |
User Behavior
User behavior tells you what visitors do on your site. You can track real-time user counts, see which pages are most popular, and watch how people click or scroll. Many tools let you view heatmaps, session recordings, and even track clicks on links. You can also segment users by location or device.
Heatmaps and session recordings
Click and scroll analysis
Tracking affiliate and outbound links
Custom dashboards for easy viewing
Conversions
Conversions show how many visitors take action, like signing up or making a purchase. WordPress sites often see conversion rates between 3% and 7%, which matches or beats the industry average of about 3%. E-commerce sites usually convert at 1.8% to 4%. Direct traffic often brings the highest conversion rates.
Category | Conversion Rate Range |
|---|---|
~3.3% | |
Ecommerce Average | 2.5% to 3% |
Direct Traffic | ~3.5% |
3% to 7% |
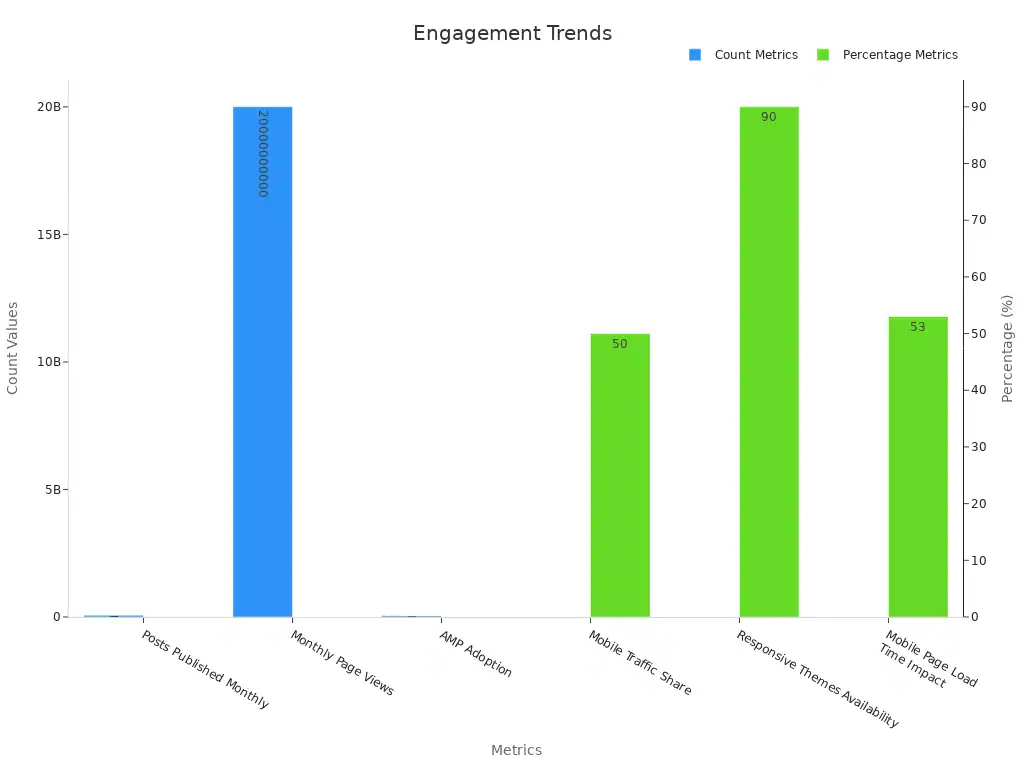
Engagement
Engagement measures how much visitors interact with your content. You can look at page views, comments, and how long users stay. WordPress sites see over 20 billion page views each month and about 77 million comments per day. Mobile users make up half of all traffic, so fast load times matter. If your site loads slowly, over half of users may leave.
Tip: Use engagement data to find your most popular posts and improve less active pages.
Setup
WordPress.com vs WordPress.org
When you set up analytics, you need to know if your site uses WordPress.com or WordPress.org. Each platform handles analytics in a different way.
WordPress.com gives you Jetpack Stats by default. This tool tracks basic numbers like visitors, traffic, referrals, and where your readers come from. You can see real-time data, post engagement, and some SEO insights. The free version works well for blogs, but it does not show deep details. If you want more, you need to pay for extra features like UTM tracking for marketing.
WordPress.org lets you choose your own analytics tools. You can add Google Analytics, which tracks much more. You get data about how people find your site, how long they stay, what they do, and even who they are. You can also use plugins like MonsterInsights to make Google Analytics easier to use. These plugins help you see user journeys, track your most popular posts, and add notes for context.
Note: WordPress.com analytics focus on simple blog stats. WordPress.org gives you more control and deeper insights with advanced tools.
Adding Analytics Tools
You can add analytics tools to your WordPress site to learn more about your visitors and how they use your site. These tools help you track user behavior, conversion rates, and where your traffic comes from. With features like custom widgets, event tracking, and e-commerce tracking, you get a better view of what works and what needs improvement. Real-time analytics let you spot problems quickly and see how new features perform. Advanced tools even offer AI-powered insights and connect with CRM systems to help you grow your site.
Popular plugins like MonsterInsights connect your site with Google Analytics. You can track page views, click-through rates, visitor sources, and conversion events right from your dashboard. This makes it easy to see what content your visitors like and where you can improve. Tracking these numbers helps you make smart choices to reach your goals.
Plugin Integration
You can set up analytics plugins on your WordPress site by following these steps:
Install and activate an analytics plugin such as MonsterInsights, Jetpack, WP Statistics, or Independent Analytics.
Add the tracking code to your site. For example, MonsterInsights will guide you through connecting your Google Analytics account. Some plugins may ask you to paste a code into your theme’s footer.
Use the plugin dashboard to view your data. You can see user engagement, traffic sources, and which posts perform best.
Try advanced features like event tracking or A/B testing. These help you test changes and see what increases conversions or keeps users engaged.
Set clear goals in your analytics tool. Use tag management systems and check your data for accuracy.
Connect your analytics with other tools using integrations like Zapier. This can automate tasks and help you manage your marketing.
Review your results. Many site owners see higher conversion rates and better engagement after adding analytics plugins.
Tip: If you care about privacy, you can use plugins like Independent Analytics or WP Statistics. These tools do not send data to third parties and help you follow privacy laws.
WordPress Website Analytics tools give you the power to understand your audience and improve your site. By setting up the right plugins, you can track what matters most and make data-driven decisions.
Plugins
Comparison
You have many choices when picking a WordPress analytics plugin. Some of the most popular options include Jetpack, MonsterInsights, Google Site Kit, WP Statistics, and Independent Analytics. Each plugin offers different features and levels of detail. The table below shows how MonsterInsights and Jetpack Stats compare:
Feature/Aspect | MonsterInsights | Jetpack Stats |
|---|---|---|
Integration | Connects with Google Analytics | Uses its own tracking system, no Google Analytics |
Tracking Features | Advanced: eCommerce, forms, ads, real-time stats | Basic: total visits, comments, limited stats |
Ease of Use | Needs Google Analytics setup; onboarding wizard | Very easy; stats in one dashboard |
Plugin Bloat | Lightweight, focused on analytics | Part of large Jetpack plugin suite |
Pricing (starting) | $39.00/year | |
Customer Support | Priority support for all paid tiers | Priority support only for top tier |
Extra Features | Popular Posts widget, Site Notes, Heading Analyzer | Analytics is a minor feature |
MonsterInsights gives you deep insights and connects with Google Analytics. Jetpack Stats works well for simple tracking and comes as part of a bigger plugin.
Other plugins like WP Statistics and Independent Analytics focus on privacy and do not send data to outside servers. Google Site Kit connects your site to Google tools and shows stats in your dashboard.
Features
Each plugin has unique features. Some track more data, while others focus on privacy or ease of use. You can see the main features and pricing in the table below:
Plugin | Pricing Details | |
|---|---|---|
MonsterInsights | Event tracking, eCommerce, affiliate & form tracking | Paid plans available |
WP Statistics | Local data storage, privacy-focused, simple reports | Free |
Independent Analytics | No third-party data sharing, GDPR-friendly | Free & paid |
Google Site Kit | Connects to Google Analytics, Search Console, AdSense | Free |
Jetpack Stats | Basic stats, easy setup, part of Jetpack suite | Free & paid |
Note: Plugins like WP Statistics and Independent Analytics help you follow privacy laws such as GDPR and CCPA. These plugins store data on your own site and do not share it with others.
Some plugins, like MonsterInsights, offer advanced reports and eCommerce tracking. Others, like Jetpack Stats, keep things simple and easy to use. You can pick a plugin that matches your needs, whether you want deep data or just the basics.
Data Insights
Reading Reports
When you look at analytics reports, you see a clear picture of how your website performs. Most WordPress plugins, such as MonsterInsights and Jetpack, give you easy-to-read dashboards. These reports show you important numbers like page views, referral sources, and user engagement. You can also track how often authors post and which categories get the most attention. Some plugins, like Content Analytics, let you:
View real-time updates and historical data
Track links and user IDs
Get regular, customizable reports
See how each author and category performs
You do not need to know advanced math. The plugins organize the data so you can spot what works and what needs improvement.
Tip: Focus on the main numbers first, such as visitors, top pages, and where your traffic comes from.
Spotting Trends
Spotting trends helps you understand what changes over time. You can use tables and charts in your analytics dashboard to see patterns. For example, you might notice more visitors on certain days or higher engagement after posting videos. Many plugins now track new trends, such as AI-driven analytics and voice search. The table below shows some key trends and features:
Trend / Metric | Description / Insight |
|---|---|
AI-driven analytics | Predicts user behavior and site performance |
Voice search analytics | Tracks how users find your site using voice commands |
Enhanced user experience tracking | Measures clicks, scrolls, and time on page |
Data privacy & compliance | Ensures your site follows GDPR and CCPA rules |
Key metrics | Bounce rate, conversion rate, user demographics, traffic sources, engagement (likes, comments, plays) |
Taking Action
You can use your data insights to make smart changes. For example, if you see a traffic spike every Monday, you can schedule new posts for that day. If your bounce rate is high, you might improve your page speed or update your design. The table below shows what actions you can take and the results you might see:
Metric / Action | Benefit / Result |
|---|---|
Conversion Rate Improvement | Simplifying forms can boost signups by 25% |
Traffic Spike Identification | Posting at peak times increases engagement and session length |
Session Duration & Bounce Rate | Updating content for trends keeps users longer |
Page Load Times & Speed | Faster pages lower bounce rates and help SEO |
Mobile Usability | Responsive design keeps mobile users on your site |
Remember: Using WordPress Website Analytics helps you find what works, fix what does not, and grow your site with confidence.
WordPress Website Analytics give you the power to see what works on your site. When you track key metrics, you learn how visitors behave and which pages they like most. Regular monitoring helps you:
Spot trends and fix problems quickly
Improve user experience and boost engagement
Make smart, data-driven changes for better results
Start using analytics tools today. You will see your website grow and reach more people.
FAQ
What is the difference between WordPress.com and WordPress.org analytics?
WordPress.com gives you built-in Jetpack Stats. WordPress.org lets you pick your own analytics tools. You get more control and deeper data with WordPress.org.
What analytics plugin should you use for privacy?
You can use WP Statistics or Independent Analytics. These plugins keep your data on your site. They help you follow privacy laws like GDPR.
What does a high bounce rate mean?
A high bounce rate means visitors leave your site after viewing one page. You may need to improve your content or site speed to keep users longer.
What is the best way to track conversions on WordPress?
You can use plugins like MonsterInsights or Google Site Kit. These plugins help you see when users sign up, buy, or take other actions.
What should you do if your traffic drops?
Check your analytics for changes in sources or user behavior. Update your content, improve site speed, and share your site on social media to bring visitors back.